
Greenhouse gas reduction
Royal A-ware recognises the impact its value chain has on the environment and is committed to reducing greenhouse gas emissions (GHG) to enhance the sustainability of its operations. We are dedicated to assessing our climate impact, establishing clear reduction targets and implementing concrete measures to mitigate our environmental footprint. In line with our Science Based Targets initiative (SBTi) approval, we aim to achieve a net-zero value chain by 2050.
Impacts, risks and opportunities
Royal A-ware carried out a comprehensive climate scenario analysis to measure the organisation's exposure to physical and transition risks using multiple climate scenarios. Our own operations, as well as the upstream and downstream value chain, are assessed. The scenarios, developed by the Royal Netherlands Meteorological Institute (KNMI), the Flanders Environment Agency (VMM) and various academic studies, are classified into high and low emission pathways. We utilise these scenarios to evaluate the variation in risks under global warming scenarios of 1.5°C and 4°C (in accordance with the SSP scenarios of IPPC) across short-, medium- and long-term horizons. Short-term climate risks refer to those materialising within one year (by 2026), medium-term risks within five years (by 2030) and long-term risks within the period between 2030 and 2050. The 4°C scenario is used to inform our assessment of physical climate risks. Due to limited scientific evidence for accurately assessing short- and medium-term climate risks in dairy, transport, and arable activities, Royal A-ware focuses on evaluating long-term physical climate risks. For transition risk an assessment is executed on the expected transitions on the short-term.
We conducted a DMA during which we identified GHG reduction as a material topic. In accordance with the ESRS, we then examined our material topics more closely by assessing their IROs taking into account the climate risk analysis. The process resulted in the following material IROs:
Impacts
-
Actual negative impact on the affordability of food products for consumers due to rising costs associated with measures to address the consequences of climate change (“climate adaptation”).
-
Actual negative impact on the affordability of food products for consumers due to rising costs associated with measures to mitigate climate change (“climate mitigation”), such as investments in production processes and vehicle fleets.
-
Actual negative impact on people and the environment caused by climate change, resulting from greenhouse gas emissions released through the combustion of fossil fuels in dairy production and transportation.
-
Actual negative impact on people and the environment caused by climate change, resulting from greenhouse gas emissions (CO₂, methane, nitrous oxide) from dairy farms.
Risks
In assessing risks, Royal A-ware, in accordance with the ESRS, distinguishes between physical risk and transition risks.
Physical risks:
-
Risk of deteriorated supply, transport, and processing of raw milk (and other products) due to extreme and/or changing weather conditions (heat stress, heatwaves, water stress, flooding).
-
Risk of increased raw material costs as a result of reduced production due to climate change.
Transition risks:
-
Risk of growth limitations for Royal A-ware due to stricter laws and regulations aimed at reducing greenhouse gas emissions, making expansion/construction of production sites impossible and/or reducing milk production.
-
Risk of increased costs due to (policy) measures such as CO₂ levies or AgriETS to reduce greenhouse gas emissions from operations and agriculture/dairy farming.
-
Risk of increased costs and insufficient access to electricity due to grid congestion.
-
Risk of cost increases from investments in electrification (trucks, boilers) or other energy sources with a lower carbon footprint (such as LNG, biogas).
-
Risk of declining raw milk production by dairy farmers due to stricter laws and regulations aimed at reducing greenhouse gas emissions from dairy farming.
-
Risk of lower profitability and/or revenue due to higher costs or reduced efficiency caused by implementing emission reduction measures.
Opportunities
In addition to risks, Royal A-ware also identified opportunies:
-
Opportunity to develop and offer different milk streams with requirements regarding climate mitigation measures at the dairy farm.
-
Opportunity for subsidies and/or incentivizing (policy) measures to implement climate mitigation actions in own operations and promote innovation, which can provide a competitive advantage.
-
Opportunity to strengthen the future resilience of Royal A-ware by investing in mitigation measures.
Resilience analysis
The Climate Risk Assessment (conducted in 2024) and the material IRO’s (following from the Double Materiality Assessment conduct in 2025) inform the resilience and the robustness of our strategy and business model. While we have not conducted an official resilience assessment as prescribed under the ESRS, we have carried out our own internal resilience analysis. In order for our business model and strategy to remain resilient and robust we have chosen to adopt a Climate Transition Plan. This plan represents the adaptation of our strategy and business model to ultimately transform towards more sustainable operations, in alignment with the Paris Agreement.
Based on our assessment, we have not identified any assets that require significant modifications to align with the transition to a climate-neutral economy.
'Our climate targets have been validated by the SBTi.'
Our approach
Royal A-ware has a climate change policy in place outlining the organisation’s climate strategy. It includes our Climate Transition Plan for addressing Scope 1 and 2 emissions, which includes energy efficiency and renewable energy deployment, as well as Scope 3 emissions. Royal A-ware does not have a formal policy in relation to climate adaptation.
Climate Transition Plan
As part of our commitment to reducing GHG emissions in our operations, we have prepared a Climate Transition Plan based on the IROs. This approach encompasses the key drivers of our carbon reduction efforts, as well as our strategy for addressing climate-related risks. The Sustainability Steering Committee is responsible for the Climate Transition Plan and its implementation; as the CEO and CFO are members, the plan is formally endorsed by the Management Board. The plan is part of our regular business planning and resource allocation process cycle. In the coming years, we will closely monitor and evaluate the effectiveness of our approach. Based on these evaluations, we may refine our plans or adjust our strategic direction as necessary.
In addition, climate targets of the dairy activities have been validated by the SBTi, demonstrating that we are actively taking climate mitigation measures in line with the Paris Climate Agreement’s goal of reaching net-zero by 2050, in line with the 1.5°C pathway. By doing so, we follow the standards and protocols of the GHG Protocol and SBTi. If we deviate from this, it is explicitly stated.
The Management Board will allocate the resources (financial and manpower) for actions needed for implementation of the climate transition plan. Allocation of resources is part of our regular course of business and thus specific allocation is not applicable. At present, Royal A-ware does not have a remuneration policy linked to the achievement of sustainability targets (including climate targets). Elements of the climate policy are communicated to relevant stakeholders. Dairy farmers are informed about climate ambitions and related activities through, among others, biannual meetings. Employees involved in the implementation of the strategy are informed by members of the Sustainability Steering Committee.
Transition plan own dairy operations
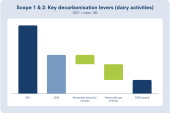
Our Scope 1 and 2 emissions are primarily the result of the consumption of natural gas and electricity. Therefore, our decarbonisation strategy is built around a renewable electricity and renewable gas strategy. This includes increasing energy efficiency and reducing energy consumption. Based on this we are taking concrete actions from 2025 ongoing, such as:
-
Investing in the use, generation and storage of renewable energy.
-
Acquiring Guarantees of Origin (GOs) and purchasing renewable electricity and gas.
-
Entering into Corporate Power Purchase Agreements (CPPAs) to secure long-term access to renewable electricity.
-
Reducing energy consumption.
-
Properly maintaining our technical installations.
-
Applying new techniques or innovations. An example: at our production location in Heerenveen the construction activities for an upgrade of our electricity supply are in 2025 almost completed, included a study for installation of an e-boiler.
Transition plan dairy value chain
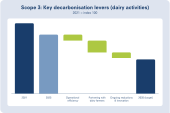
Our Scope 3 emissions are the result of purchased goods, upstream and downstream transport, waste generated during processing, use of our products by consumers. Since the largest share of our Scope 3 emissions is associated with milk production by dairy farmers, our decarbonisation levers include collaboration with dairy farmers. Operational efficiency, driven by reductions in Scope 1 and 2 energy consumption, also contributes to lowering several Scope 3 emissions. As well as ongoing reductions and innovation that contribute to lower emissions. Within these levers, we are taking concrete actions from 2025 ongoing such as:
-
Working with farmers to reduce carbon footprint through our Dairy Academy initiative. The Dairy Academy supports farmers through sharing knowledge on best dairy farming practices through workshops and field trips.
-
Incentivising dairy farmers in the Netherlands and Belgium to reduce their own greenhouse gas emissions via our footprint premium.
-
Encouraging dairy farmers in the Netherlands and Belgium to increase the sustainability of their farms through our A-ware Duurzaam programme.
-
Advancing carbon sequestration initiatives with dairy farmers to reduce GHGs.
-
Upcycling cheese side streams.
Transition plan transport operations
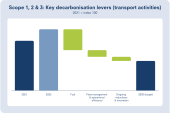
The emissions of our transport operations are primarily the result of the consumption of fuel. Therefore, in 2025, we established a climate reduction policy for the transport activities based on two pillars: fleet management and operational efficiency including reducing mileage and fuel consumption and utilising alternative fuels and propulsions. Within these levers, we are taking concrete actions from 2025 ongoing such as:
-
Optimising our drivers’ driving style to help them drive more economically and reduce maintenance coats. All AB Texel drivers in the Netherlands participate in at least one session with a driving coach, which is monitored by a software programme.
-
Properly maintaining our fleet.
-
Exploring opportunities to work with customers and others to reduce empty miles.
-
Exploring use of alternative renewable fuels like electricity and bio-LNG.
Locked-in emissions
Royal A-ware has not identified activities that would lead to substantial locked-in GHG emissions or that would be misaligned with the requirements of Commission Delegated Regulation (EU) 2021/2139 concerning the EU Taxonomy.
For Scope 3 emissions, we identified consumer behaviours as a potential source of locked-in emissions. These include activities such as transportation to and from supermarkets, refrigeration and dishwashing. We concluded that the emissions associated with consumer behaviours do not present a material risk to achieving our objectives.
Unavoidable emissions
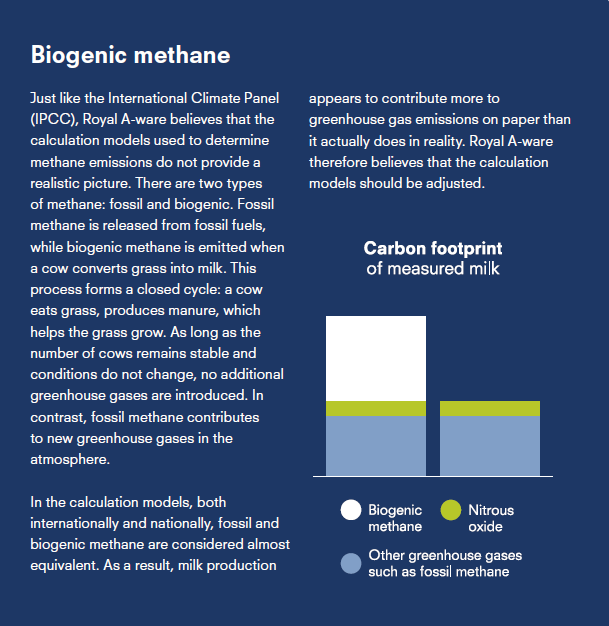
Methane emissions from cows constitute an unavoidable category of GHG emissions.
Biogenic methane emissions are an inherent byproduct of the cow’s natural digestion process and cannot be entirely eliminated. However, these emissions exist within a closed-loop system and their impact is less than fosile methane.
'We discovered that substantial amounts of carbon are stored much deeper in the soil.'
Carbon sequestration
We encourage carbon sequestration in agricultural soils to partly offset the emissions from dairy production in the future. We achieve this through long-term agreements with dairy farmers. These agreements stipulate that farmers refrain from tillage of grassland to trapping CO2 in the soil. Dairy farmers in our Beter voor Natuur & Boer milk stream agree to refrain from cultivating their land to enhance carbon sequestration.
Royal A-ware chooses to carry out large-scale direct measurements at different soil depths to more precisely measure carbon sequestration, rather than relying on models. Our research extends carbon measurements to deeper soil layers, down to 30-60 centimetres, whereas most existing studies focus only on the top 30 centimetres. By doing so, we discovered that substantial amounts of carbon are stored much deeper in the soil profile. Our pilot covered 20,000 hectares of our dairy farms, and our methodology has been recognised as scientifically robust by the Stichting Nationale Koolstofmarkt (SNK).
Also with dairy farmers who do not participate in the Beter voor Natuur & Boer milk stream Royal A-ware has started with carbon sequestration. These farmers can participate in the carbon pool of Royal A-ware and increase carbon storage by no tillage of their grasslands. Through this initiative, we collaborate with our farmers to lower greenhouse gas emissions throughout our supply chains. The carbon pool is fully aligned with the requirements of SNK.
Targets and achievements
We have defined targets to manage material climate-related IROs, covering all scopes. We distinguish between dairy production and transportation targets to reflect the unique nature of each activity. Our emission reduction targets use 2021 as the baseline year, with 2030 serving as an intermediate goal toward our 2050 ambition. The targets related to our dairy production activities are aligned with the SBTi.
Overall targets
Since 2021, the base year for calculation of greenhouse gases, quite a lot of production locations have been added to Royal A-ware that have had a material impact on the total amount of greenhouse gases. Due to material changes in the number of production facilities compared to our base year 2021, we have recalculated the emissions for the baseline year. For this recalculation we have used emission factors for 2021. The 2024 comparative and performance figures have not been adjusted to reflect the baseline year change.
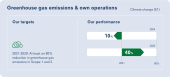
Dairy production - Scope 1 & 2
The total Scope 1 and 2 emissions for Dairy activities have decreased significantly, despite the acquisition of several new production locations (The Dairy Food Group in Belgium), in relation to emissions in 2024. This is partly due to buying GOs and partly due to using a revised emission factor. Also the 2024 figures of Scope 2 have been adjusted using a revised emission factor.
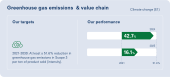
Dairy production - Scope 3
In addition to the recalculation of the base year 2021, we have used a new methodology for calculating the greenhouse gases for Scope 3. In comparison with 2024, where the calculations were based on sold products, in 2025 we have used a more detailed breakdown in milk streams inflow and products sold. This has resulted in a more realistic representation of our emissions.
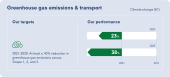
Transport activities - Scope 1, 2 and 3
In 2025 no major changes have been made to the calculation of emissions for the transport activities. All scopes show more emissions in 2025 compared to 2024. Compared to our base year there is a substantial increase in emissions due to a continuing expansion of the transport activities. The 2024 figures have been updated as a consequence of more complete figures.
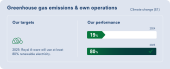
Renewable electricity
In 2025, we increased our share of renewable electricity through the signing of several CPPAs and the installation of additional solar panels (or the acquisition of sites equipped with them). To meet the remainder of our 2025 target, we purchased European Guarantees of Origin for our Dutch and Belgian operations. The contractual agreements consist 96% out of GO’s and 4% out of CPPAs.
Greenhouse gas emissions
|
Dairy activities |
Milestones and target years |
||||||
|---|---|---|---|---|---|---|---|
|
Baseyear 2021* |
2024 |
2025 |
%N/ N-1 |
2030 |
2050 |
Annual |
|
|
Scope 1 GHG emissions* |
|||||||
|
Gross Scope 1 GHG emissions (tCO2eq) |
51,656 |
47,178 |
59,420 |
26% |
-80% |
-90% |
-40% |
|
Percentage of Scope 1 |
|||||||
|
GHG emissions from regulated emission trading schemes (%) |
26% |
72% |
61% |
||||
|
Scope 2 GHG emissions* |
|||||||
|
Gross location-based Scope 2 GHG emissions (tCO2eq) |
51,630 |
32,007 |
30,011 |
||||
|
Gross market-based Scope 2 GHG emissions (tCO2eq) |
51,630 |
31,646 |
2,794 |
-91% |
-80% |
-90% |
-40% |
|
Significant Scope 3 GHG emissions |
|||||||
|
Total Gross indirect (Scope 3) GHG emissions (tCO2eq) |
3,228,475 |
5,780,320 |
3,710,582 |
-36% |
|||
|
1 Purchased goods and services |
3,099,622 |
5,470,047 |
3,512,545 |
||||
|
3 Fuel and energy-related activities (not included in Scope 1 or Scope 2) |
15,131 |
14,775 |
17,566 |
||||
|
4 Upstream transportation and distribution |
19,391 |
38,947 |
24,497 |
||||
|
5 Waste generated in operations |
20,066 |
42,902 |
66,066 |
||||
|
6 Business traveling |
1 |
101 |
259 |
||||
|
7 Employee commuting |
1,699 |
2,540 |
2,867 |
||||
|
9 Downstream transportation |
8,361 |
35,949 |
9,170 |
||||
|
11 Use of sold products |
41,284 |
153,363 |
45,274 |
||||
|
12 End-of-life treatment of sold products |
22,919 |
3,530 |
25,134 |
||||
|
15 Investments |
- |
19,213 |
7,204 |
||||
|
Total GHG emissions (location-based) (tCO2eq) |
3,331,762 |
5,858,675 |
3,800,013 |
-35% |
|||
|
Total GHG emissions (market-based) (tCO2eq) |
3,331,762 |
5,859,144 |
3,772,797 |
-36% |
|||
|
*numbers are adjusted compared to the 2024 report as a result of updates made in the methodology to calculate emissions (see page 38). |
|||||||
Greenhouse gas emissions
|
Transport activities |
Milestones and target years |
||||||
|---|---|---|---|---|---|---|---|
|
Baseyear 2021 |
2024 |
2025 |
%N/ N-1 |
2030 |
2050 |
Annual |
|
|
Scope 1 GHG emissions* |
|||||||
|
Gross Scope 1 GHG emissions (tCO2eq) |
129,930 |
145,345 |
149,117 |
3% |
-40% (including Scope 2&3) |
38% |
|
|
Percentage of Scope 1 |
|||||||
|
GHG emissions from regulated emission trading schemes (%) |
0 |
0% |
0% |
||||
|
Scope 2 GHG emissions* |
|||||||
|
Gross location-based Scope 2 GHG emissions (tCO2eq) |
1,323 |
586 |
633 |
8% |
-40% (including Scope 2&3) |
38% |
|
|
Gross market-based Scope 2 GHG emissions (tCO2eq) |
1,323 |
586 |
633 |
8% |
|||
|
Significant Scope 3 GHG emissions |
|||||||
|
Total Gross indirect (Scope 3) GHG emissions (tCO2eq) |
60,273 |
98,057 |
115,335 |
18% |
-40% (including Scope 2&3) |
38% |
|
|
1 Purchased goods and services |
15,051 |
18,345 |
19,052 |
||||
|
3 Fuel and energy-related activities (not included in Scope 1 or Scope 2) |
23,384 |
49,408 |
51,494 |
||||
|
5 Waste generated in operations |
1 |
1 |
- |
||||
|
6 Business traveling |
1 |
1 |
- |
||||
|
7 Employee commuting |
641 |
956 |
5,710 |
||||
|
9 Downstream transportation |
21,195 |
29,346 |
39,079 |
||||
|
Total GHG emissions (location-based) (tCO2eq) |
191,526 |
243,988 |
265,085 |
9% |
|||
|
Total GHG emissions (market-based) (tCO2eq) |
191,526 |
243,988 |
265,085 |
9% |
|||
|
* The 2024 figures have been updated as a consequence of more complete figures (see page 39). |
|||||||
Greenhouse gas emissions
|
Energy consumption and mix |
2024 |
2025 |
|---|---|---|
|
(1) Fuel consumption from coal and coal products (MWh) |
372 |
- |
|
(2) Fuel consumption from crude oil and petroleum products (MWh) |
506,414 |
564,350 |
|
(3) Fuel consumption from natural gas (MWh) |
260,802 |
323,138 |
|
(4) Fuel consumption from other fossil sources (MWh) |
4 |
- |
|
(5) Consumption of purchased or acquired electricity, heat, steam, and cooling from fossil sources (MWh) |
109,512 |
32,993 |
|
(6) Total fossil energy consumption (MWh) (calculated as the sum of lines 1 to 5) |
877,104 |
920,480 |
|
Share of fossil sources in total energy consumption (%) |
92% |
86% |
|
(7) Consumption from nuclear sources (MWh) |
406 |
- |
|
Share of consumption from nuclear sources in total energy consumption (%) |
0% |
0% |
|
(8) Fuel consumption for renewable sources, including biomass (also comprising industrial and municipal waste of biologic origin, biogas, renewable hydrogen, etc.) (MWh) |
52,740 |
20,754 |
|
(9) Consumption of purchased or acquired electricity, heat, steam, and cooling from renewable sources (MWh) |
25,779 |
119,096 |
|
(10) The consumption of self-generated non-fuel renewable energy (MWh) |
9,476 |
|
|
(11) Total renewable energy consumption (MWh) (calculated as the sum of lines 8 to 10) |
78,518 |
149,326 |
|
Share of renewable sources in total energy consumption (%) |
8% |
14% |
|
Total energy consumption (MWh) (calculated as the sum of lines 6 and 11) |
956,029 |
1,069,806 |
|
Intensity |
2024 |
2025 |
%N/ N-1 |
|---|---|---|---|
|
Energy intensity per net revenue |
|||
|
Total energy consumption from activities in high climate impact sectors per net revenue from activities in high climate impact sectors (MWh/EUR millions) |
251 |
242 |
-3% |
|
GHG intensity per net revenue |
|||
|
Total GHG emissions (location-based) per net revenue (tCO2eq/EUR millions) |
1,600 |
920 |
-43% |
|
Total GHG emissions (market-based) per net revenue (tCO2eq/EUR millions) |
1,601 |
914 |
-43% |
|
Net revenue used to calculate GHG intensity (EUR millions) - as stated in note 19 of the financial statements |
3,813 |
4,418 |
16% |